Blog > Your July 2025 Market Report
Your July 2025 Market Report
Dive into July's market stats below!

What Went Down in July
Market Overview
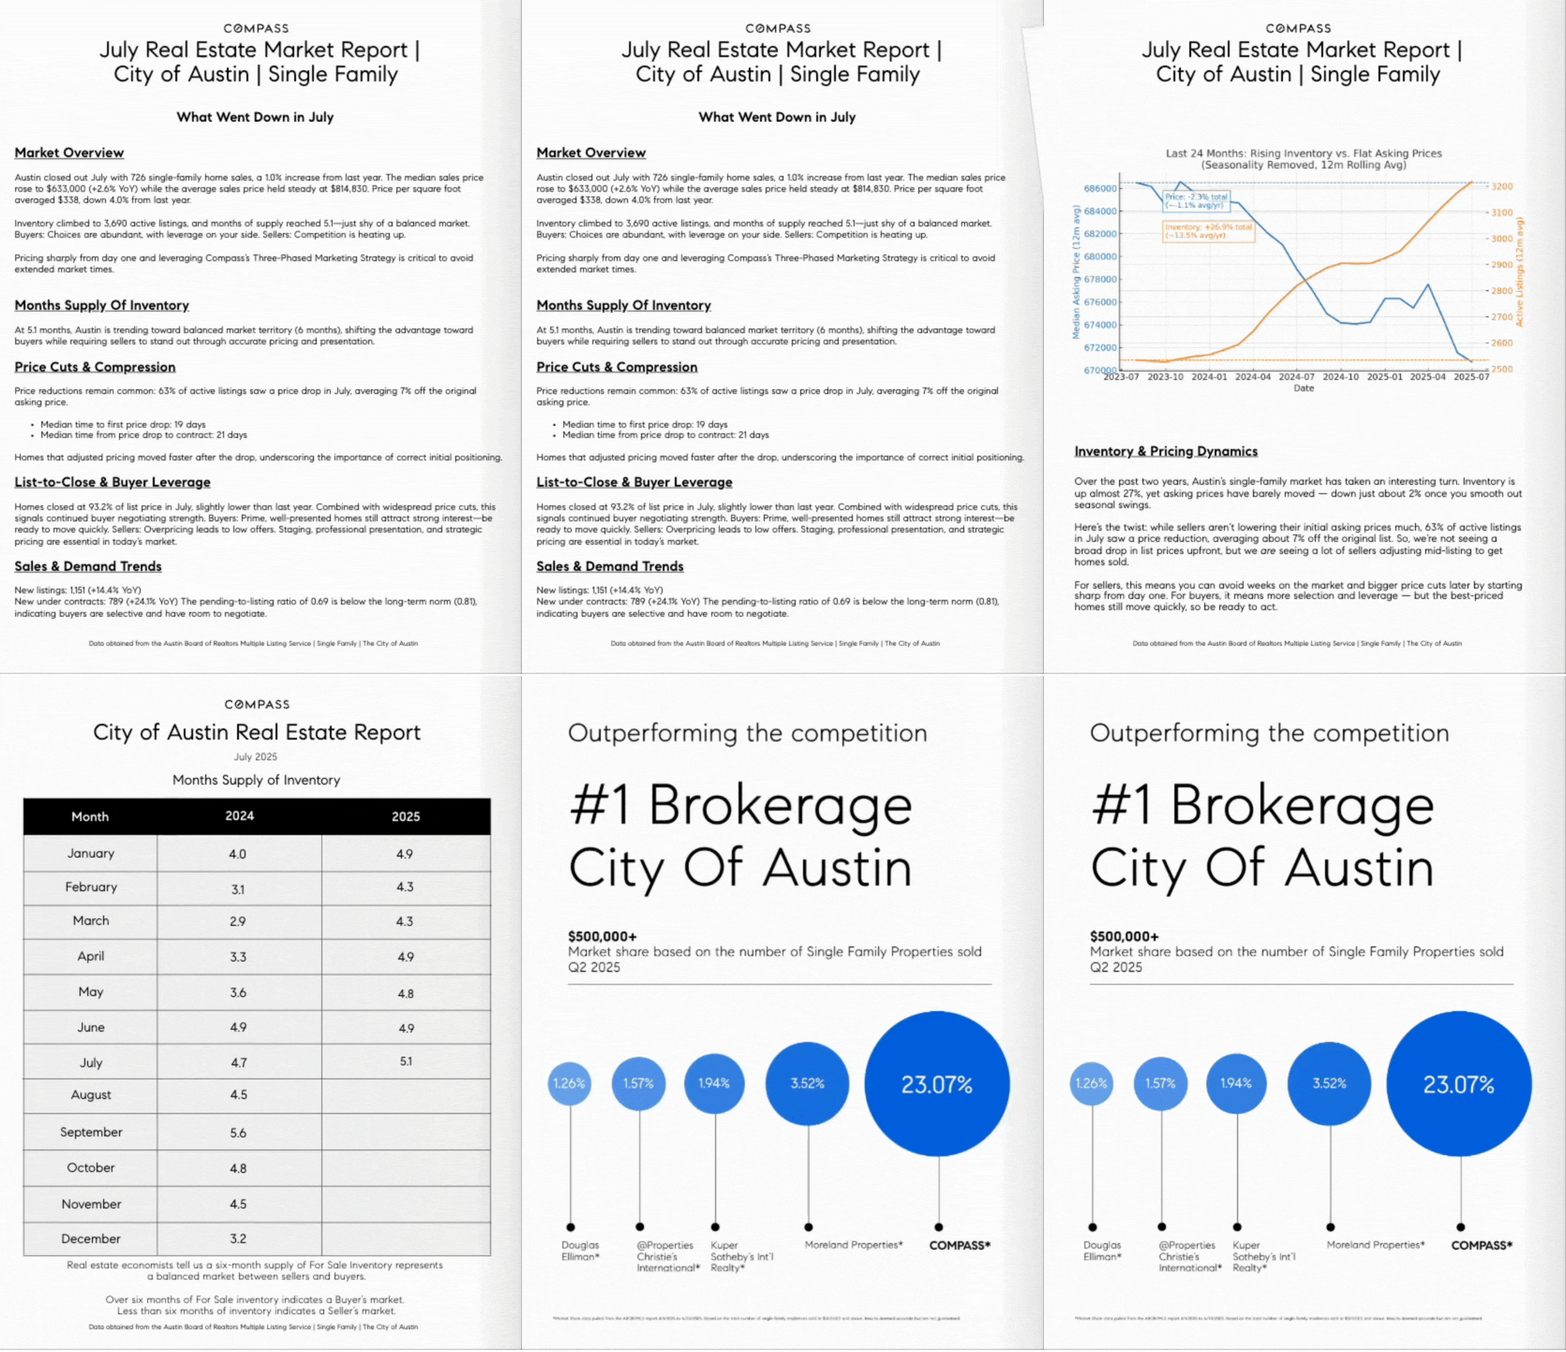
Austin closed out July with 726 single-family home sales, a 1.0% increase from last year. The median sales price rose to $633,000 (+2.6% YoY) while the average sales price held steady at $814,830. Price per square foot averaged $338, down 4.0% from last year.
Inventory climbed to 3,690 active listings, and months of supply reached 5.1—just shy of a balanced market. Buyers: Choices are abundant, with leverage on your side. Sellers: Competition is heating up.
Pricing sharply from day one and leveraging Compass’s Three-Phased Marketing Strategy is critical to avoid extended market times.
Months Supply Of Inventory
At 5.1 months, Austin is trending toward balanced market territory (6 months), shifting the advantage toward buyers while requiring sellers to stand out through accurate pricing and presentation.
Price Cuts & Compression
Price reductions remain common: 63% of active listings saw a price drop in July, averaging 7% off the original asking price.
Median time to first price drop: 19 days
Median time from price drop to contract: 21 days
Homes that adjusted pricing moved faster after the drop, underscoring the importance of correct initial positioning.
List-to-Close & Buyer Leverage
Homes closed at 93.2% of list price in July, slightly lower than last year. Combined with widespread price cuts, this signals continued buyer negotiating strength. Buyers: Prime, well-presented homes still attract strong interest—be ready to move quickly. Sellers: Overpricing leads to low offers. Staging, professional presentation, and strategic pricing are essential in today’s market.
Sales & Demand Trends
New listings: 1,151 (+14.4% YoY)
New under contracts: 789 (+24.1% YoY) The pending-to-listing ratio of 0.69 is below the long-term norm (0.81), indicating buyers are selective and have room to negotiate.
90-Day Trend & July Month-to-Date
Since May, active inventory has steadily increased, with new listings regularly outpacing pending contracts. August month-to-date shows 223 new listings and 177 pendings, with a average of 46 days on market—slower than seasonal norms.
What’s Coming Next (60-Day Outlook)
Buyer-friendly conditions are expected to persist into early fall. Inventory remains high at 3,690 active listings with 5.1 months of supply. New listings are up 14.4% YoY, while price reductions affected 63% of active inventory, averaging 7%. Buyers: Expect more selection and continued opportunities for concessions, but move quickly on well-priced homes. Sellers: Stand out with competitive pricing, strong staging, and targeted marketing to capture buyer attention in a crowded field.
Economy & Rates Snapshot from our OriginPoint Partner
Economic signals are mixed as the labor market shows signs of cooling. Weekly jobless claims climbed to 226,000 and continuing claims reached their highest level since 2021, pointing to slower re-employment. Inflation in services remains elevated, driven by tariffs and a weaker dollar, complicating the Federal Reserve’s next moves.
Leadership uncertainty adds to market watchfulness, with Christopher Waller—a hawkish, data-driven Fed governor—emerging as the leading candidate to succeed Jerome Powell. His approach suggests a strong focus on inflation control, though he recently dissented in favor of a small rate cut, citing labor market weakness.
In the bond market, short-term Treasury yields have risen while the 10-year yield dipped to 4.24%, reflecting caution and rising stagflation concerns. Mortgage rates held steady in recent trading, leaving affordability pressures unchanged for now. All eyes are on next week’s CPI report for the next potential market mover.
OriginPoint
Jonathan Kauzlarich


