Blog > AUSTIN Real Estate Market Report | March 2025
Your March 2025 Market Report
Read below to learn what is happening in the Austin real estate market right now.
View Full Report
Here’s What You Need to Know
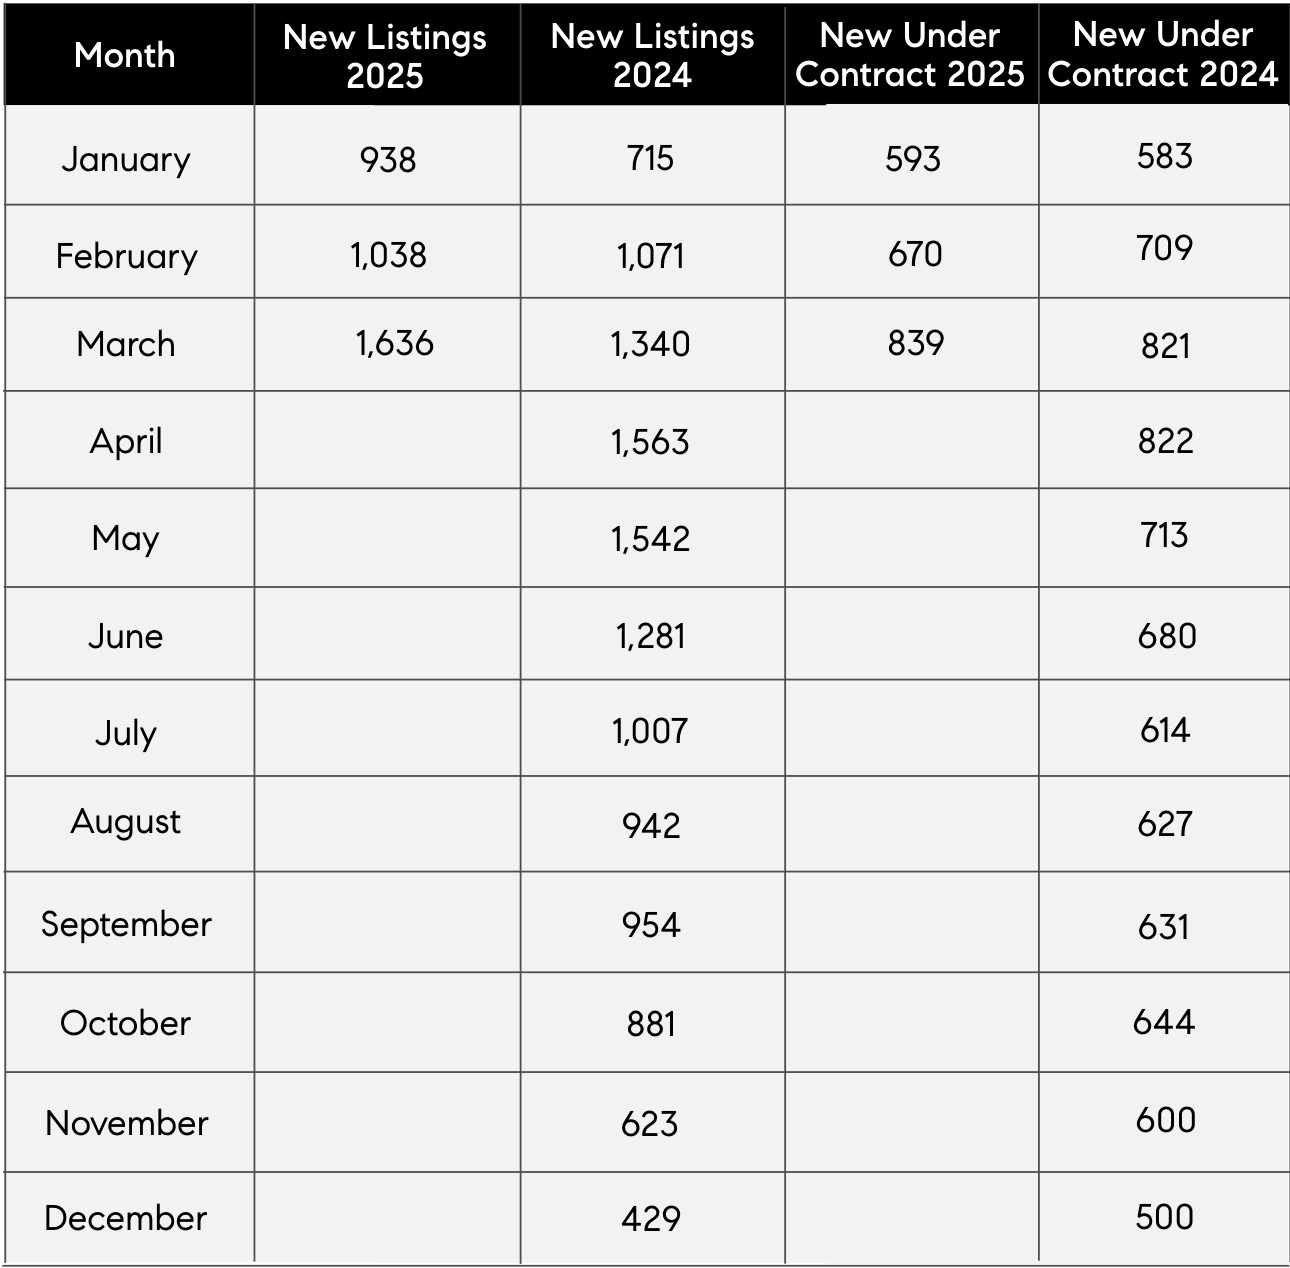
As we enter the Spring market, fresh inventory is key with 1,636 new listings added—a 22% rise compared to the same period last year. Buyer demand remains stable, with 839 new contracts signed in March, a 2.3% drop from the same time, last year.
As we enter the Spring market, fresh inventory is key with 1,636 new listings added—a 22% rise compared to the same period last year. Buyer demand remains stable, with 839 new contracts signed in March, a 2.3% drop from the same time, last year.
March saw a 10% drop in closed sales compared to last year. However, the median price increased by 4% to $619,000, suggesting stronger demand for higher-priced properties in the City of Austin.
Homes on Deck in March
There were 2,719 active single family listings in March for the City of Austin. This is over 10% more available inventory than the same time last year.
4.3 Months of Inventory
The City of Austin has roughly 4.3 months worth of inventory indicating a good balance of supply and buyer demand.
Sales Pulse
The average days on market decreased from the previous month to 62 days, indicating the beginning of the Spring selling season. This marks a slight increase of 4 days compared to the previous year.
Price Tag Trends
Median Sales Price: $619,000
New Contracts Written: 839
Median List Price U/C = $625,000
Average List Price U/C = $819,079
Median List Price = $649,000
Average List Price = $844,799
Buyer and Seller Clues
As indicated above, homes sold in an average of 62 days, marking an increase of 4 days compared to the same period last year. In March, 43% of new contracts were for newly listed homes, showing demand for fresh inventory. The average ratio of sold price to original list price remains steady at 94.5%, unchanged from last year. Overall, it's a balanced market with more options for buyers and consistent demand.
Pending New Listings Vs Existing Inventory - Single Family - City of Austin
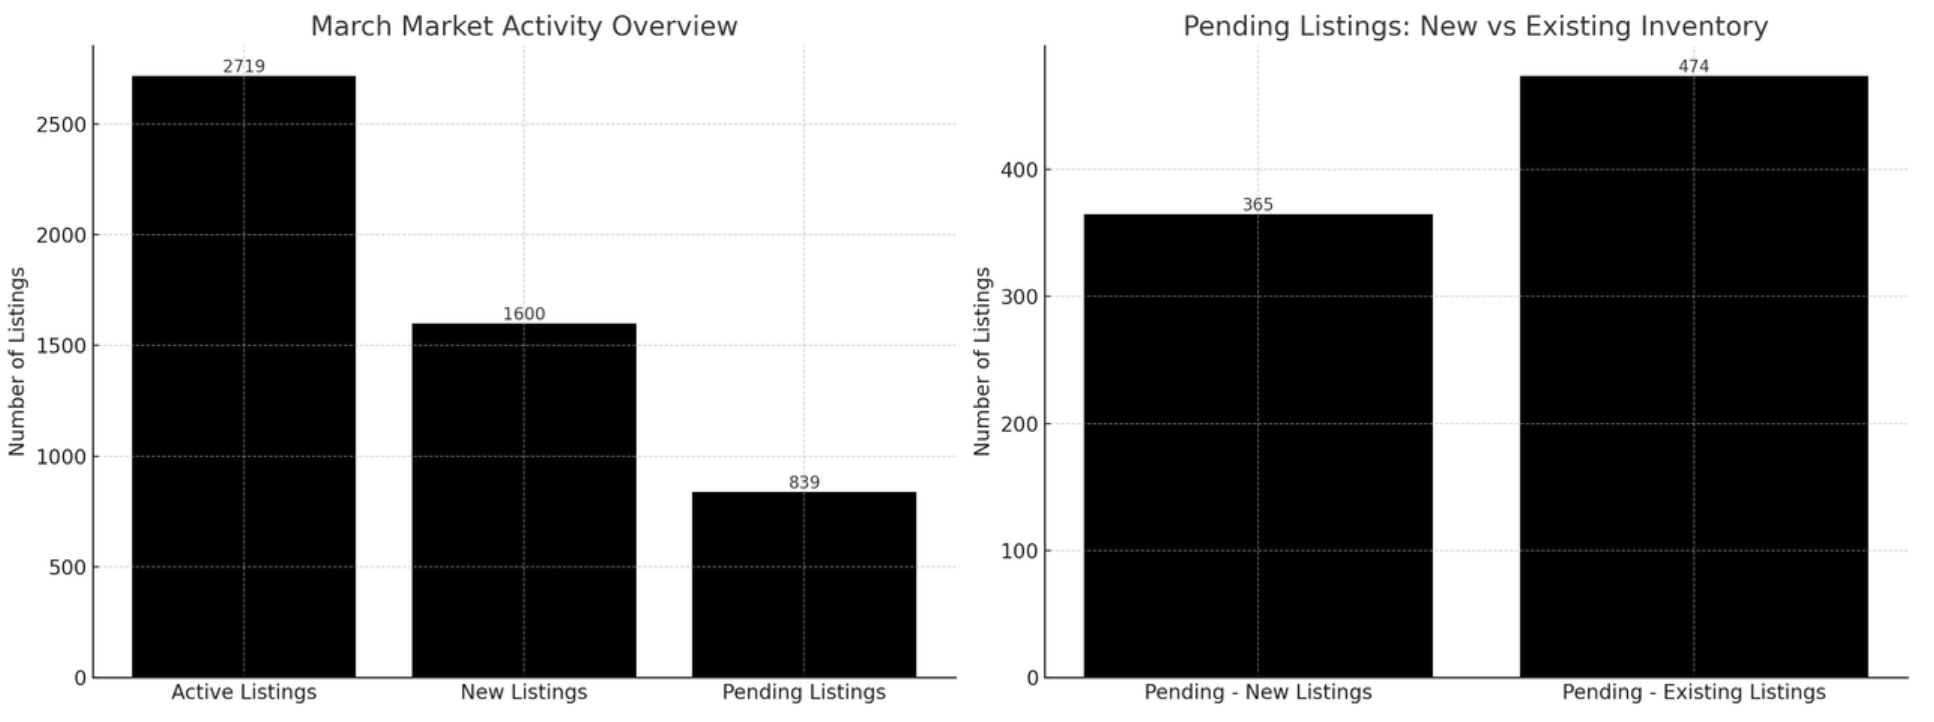
March Market Snapshot: Fresh Inventory Matters
In March, buyers made one thing clear: they want new listings.
Out of 2,719 active listings:
1,600 were newly added to the market in March.
1,600 were newly added to the market in March.
839 listings went under contract (pending).
Of those pending sales, 43.5% were from new March listings — and they sold fast, averaging just 9.75 days on the market.
In comparison, older listings that finally went pending took over 77 days on average.
What this means: Buyers are acting quickly on fresh, well-positioned inventory — and skipping over stale listings. If you’re considering selling, timing your launch and first impression is everything in this market.
Average Days on Market | Original List Price to Sold Price %
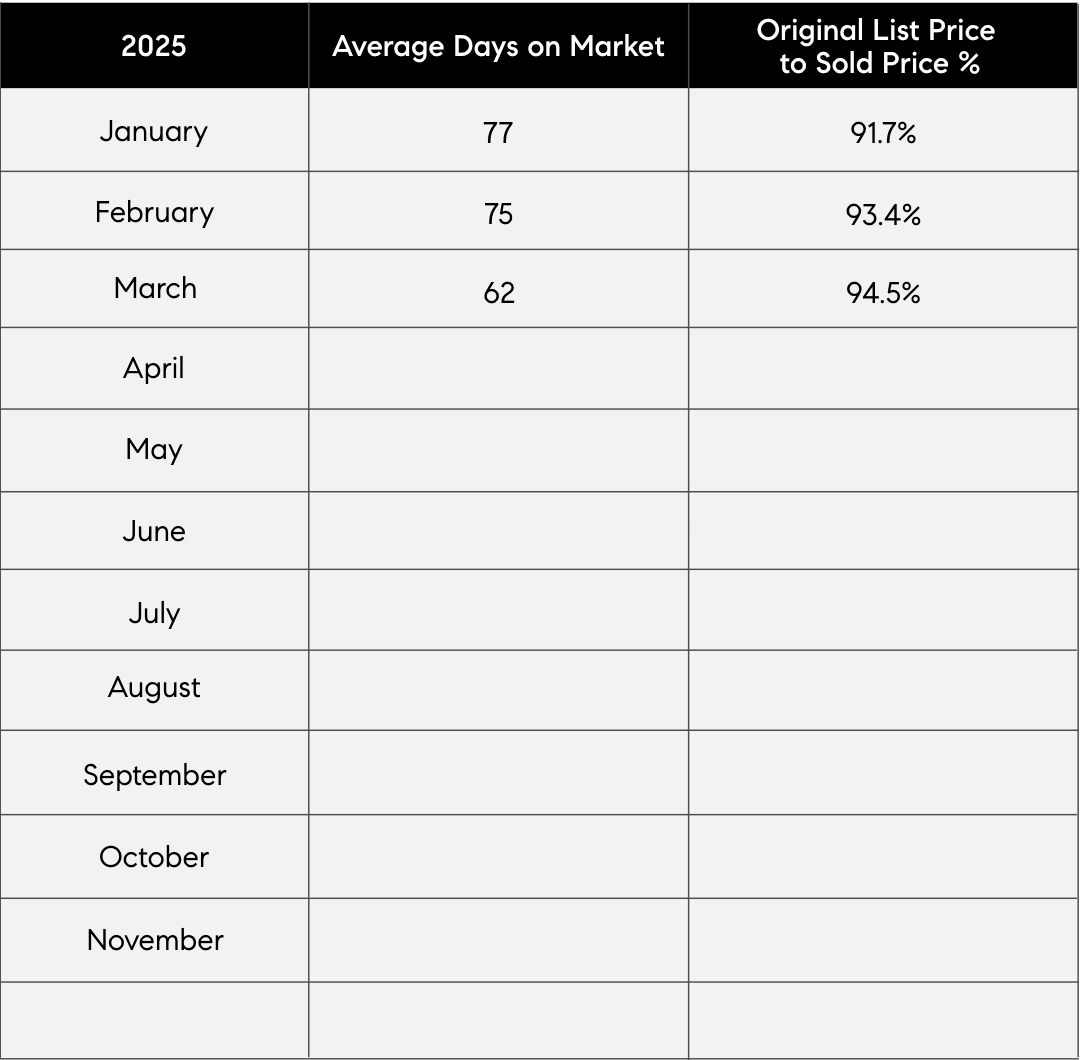
The Average DOM shows the number of days a property was on the market before it sold. An upward trend in DOM indicates a move toward a Buyer’s market.
The Sold Price vs. Original List Price reveals the percentage of the Original List Price properties sold for.
Monthly Supply of Inventory
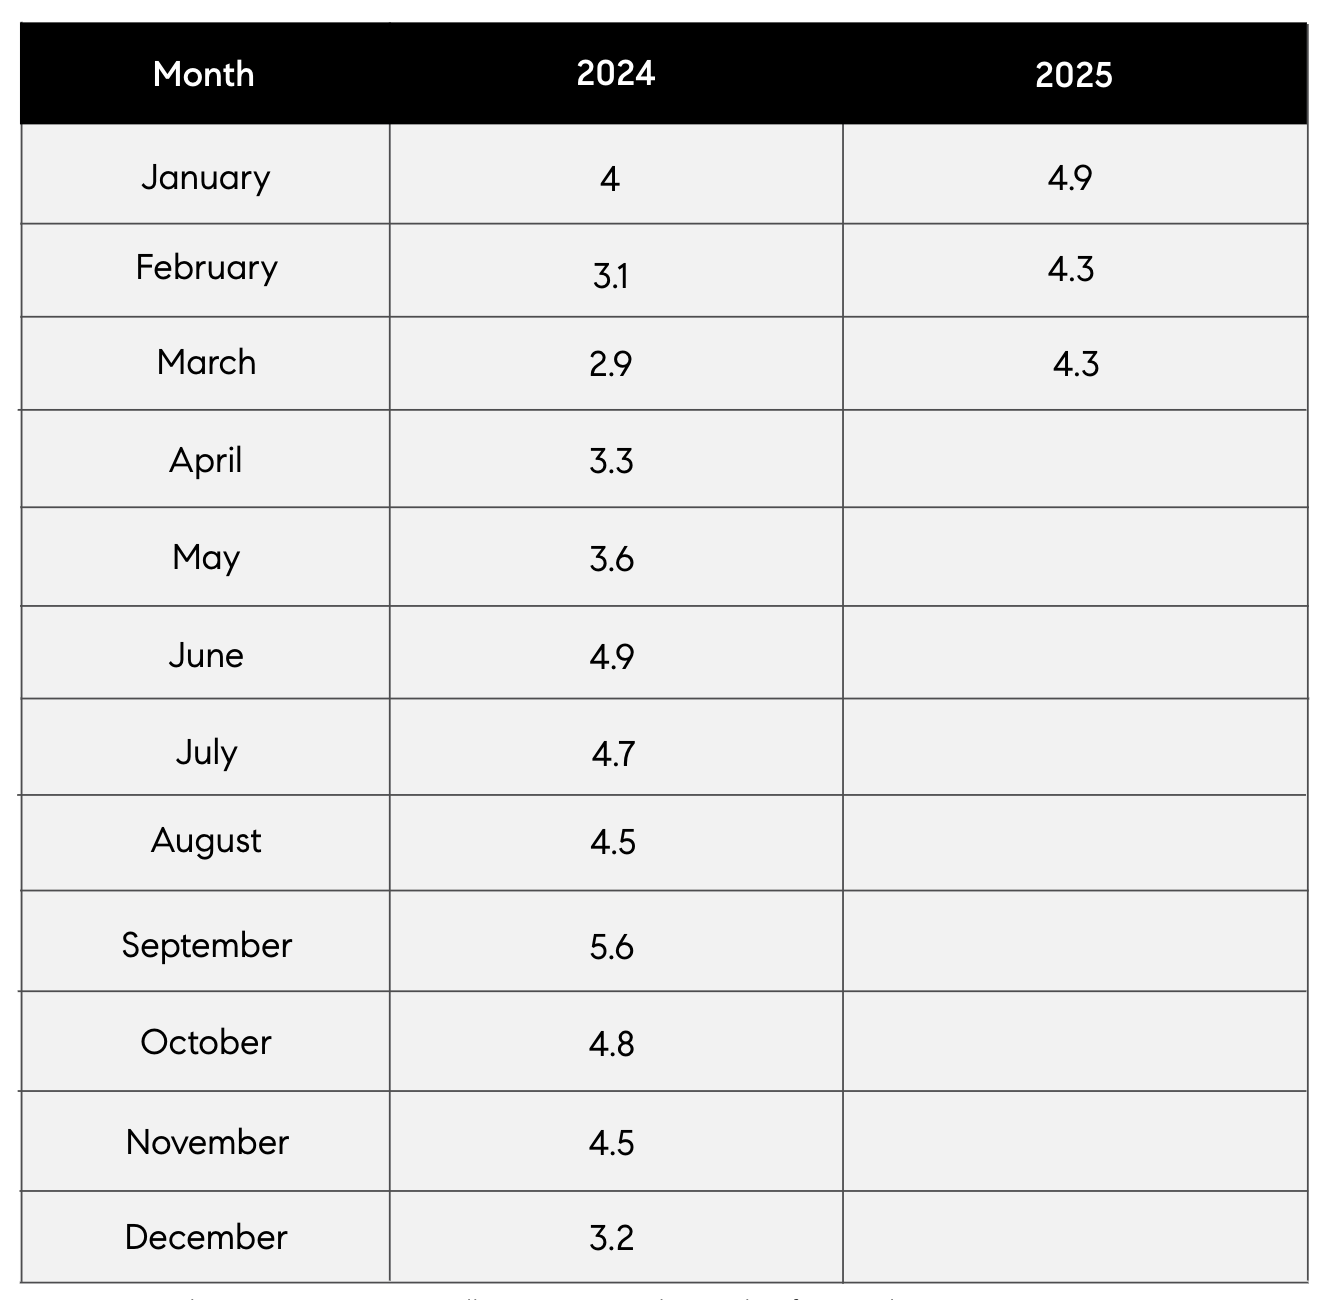
Real estate economists tell us a six-month supply of For Sale Inventory representsa balanced market between sellers and buyers.
Over six months of For Sale inventory indicates a Buyer’s market. Less than six months of inventory indicates a Seller’s market.
New Listing Taken | New Under Contracts
View Full Report
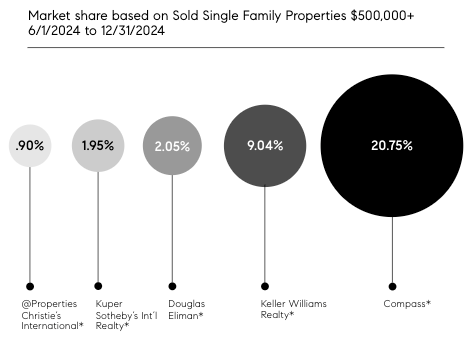
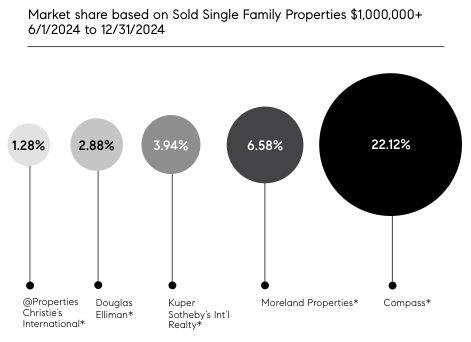
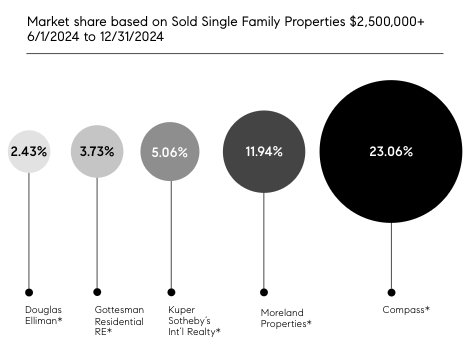
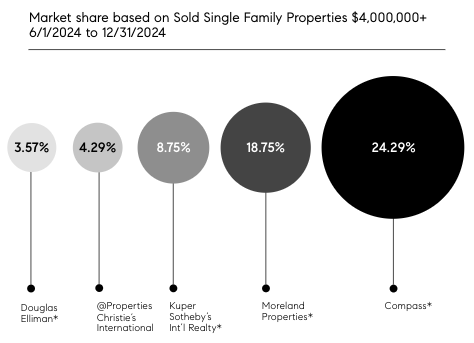
Compass Market Share By Price
Sold Single Family Property
View Full Report
Thanks for reading!Ready to achieve your next real estate goal? Please reach out to chat.
Follow me at @austinfinehomes for more real estate tips and insight!
Beata Burgeson
512-795-9900
Beata@beataburgeson.com