Blog > Your May 2025 Market Report
Your May 2025 Market Report
Discover the newest trends in Austin's residential real estate market.
Here’s What You Need to Know
Closed sales in May fell 8.8% from last year to 811, but this gap is closing as new contracts rise annually and monthly.
New contracts in May grew 18.4% from last year and 9% from last month, totaling 1,262, indicating increased buyer demand.
Available inventory increased 17% from last year, with 4,055 active listings. Although new listings slowed from last month, they were still 6.7% higher than last year.
The average market time remains stable at 41 days, with homes closing at 95.12% of the original list price.
Homes on Deck
In May, Austin had 4,055 active single-family listings, up 17% from last year but down 9.5% from the previous month.
5 Months of Inventory
The City of Austin currently has approximately 4.8 months of inventory, suggesting a balanced supply and demand.
Sales Pulse
The average number of days on the market is fairly consistent with the previous month, holding steady at 41 days. This represents a modest reduction of 3 days from the same period last year.
Price Tag Trends
Median Sales Price: $647,000
New Contracts Written: 1,262
Median List Price U/C = $659,000
Average List Price U/C = $855,797
Median List Price = $675,000
Average List Price = $913,067
Buyer and Seller Clues
Homes were sold in an average of 41 days, which is 3 days slower than the same period last year.
Properties are closing at approximately 95.12% of the original list price, with 54% of the inventory seeing a price reduction, averaging a 7% decrease.
Average Days on Market Sold Price to Original List Price %
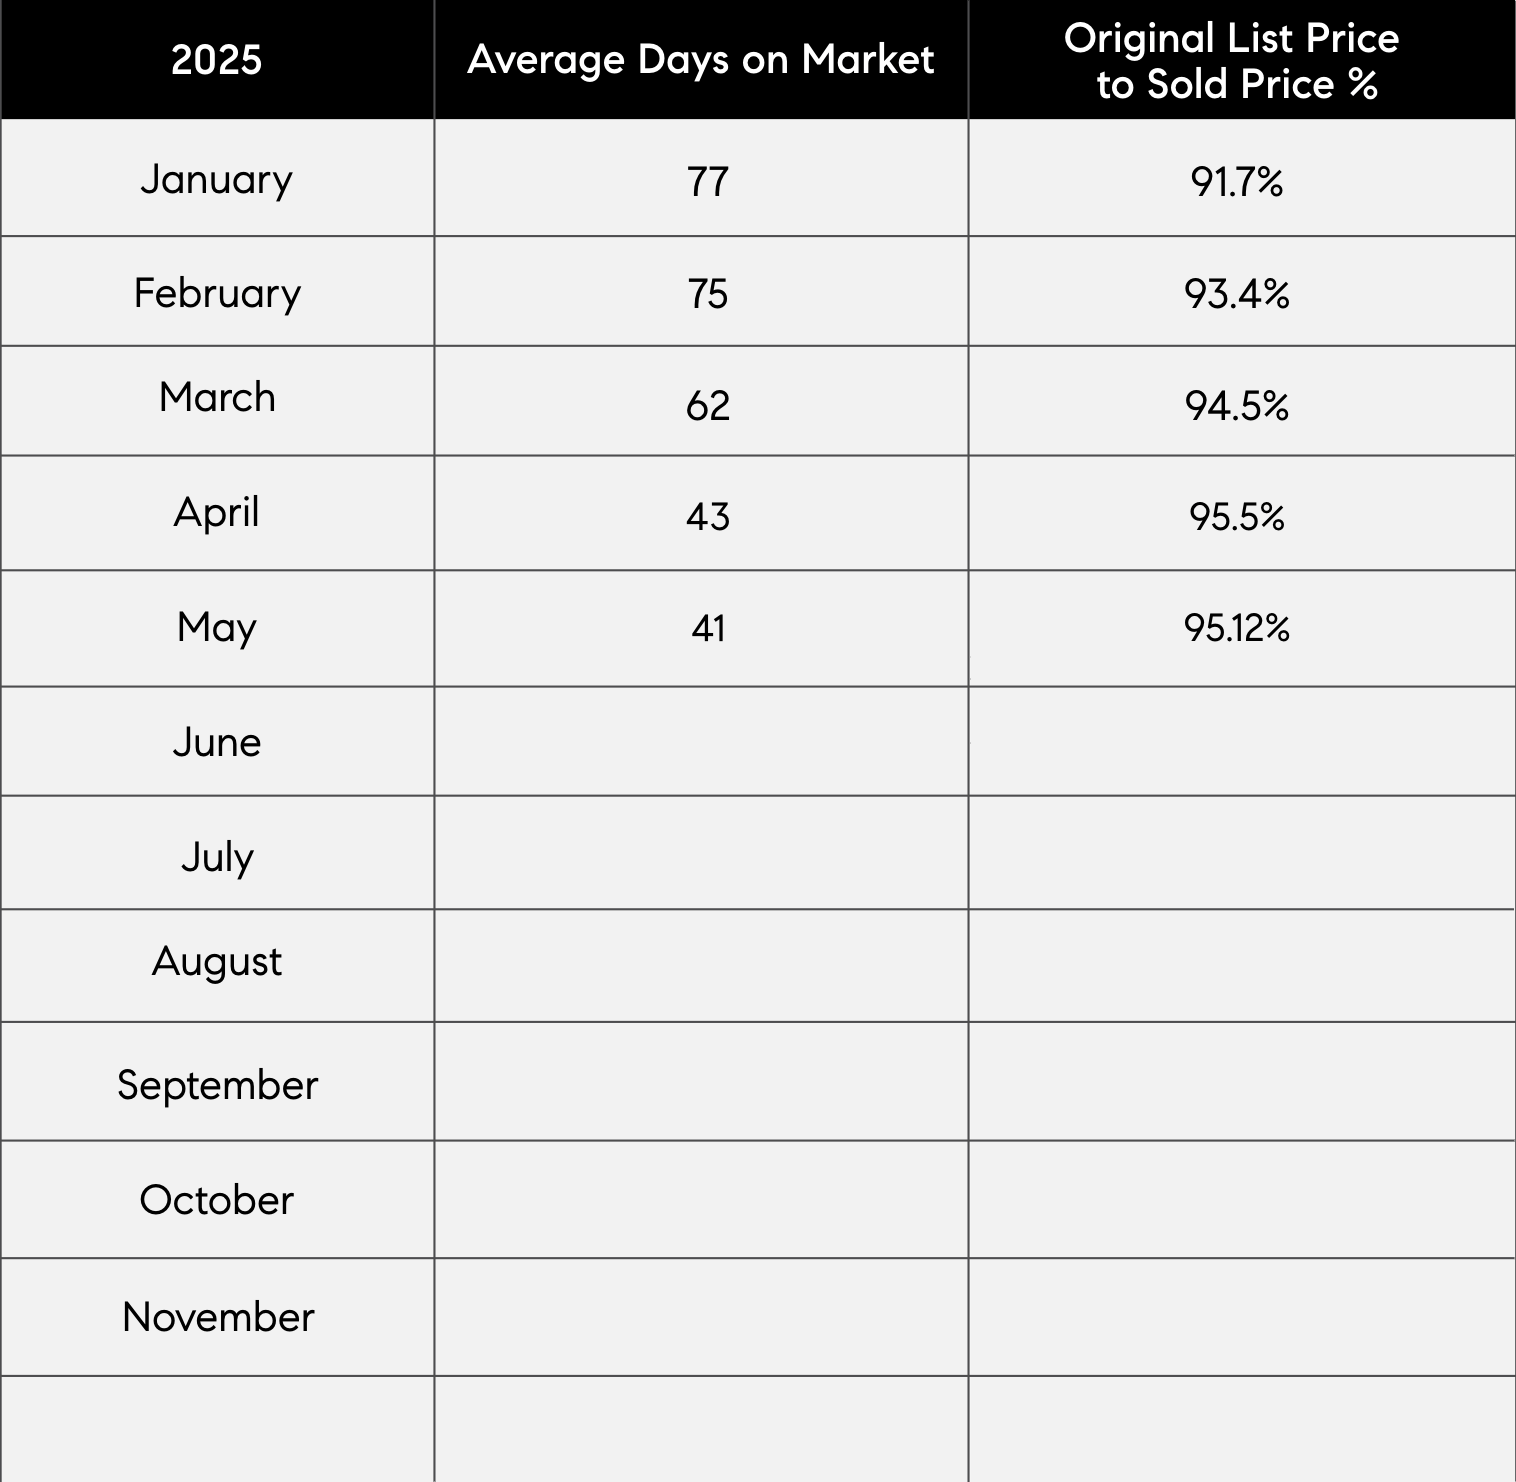
The Average DOM shows the number of days a property was on the market before it sold. An upward trend in DOM indicates a move toward a Buyer’s market.
The Sold Price vs. Original List Price reveals the percentage of the Original List Price properties sold for.
Monthly Supply of Inventory
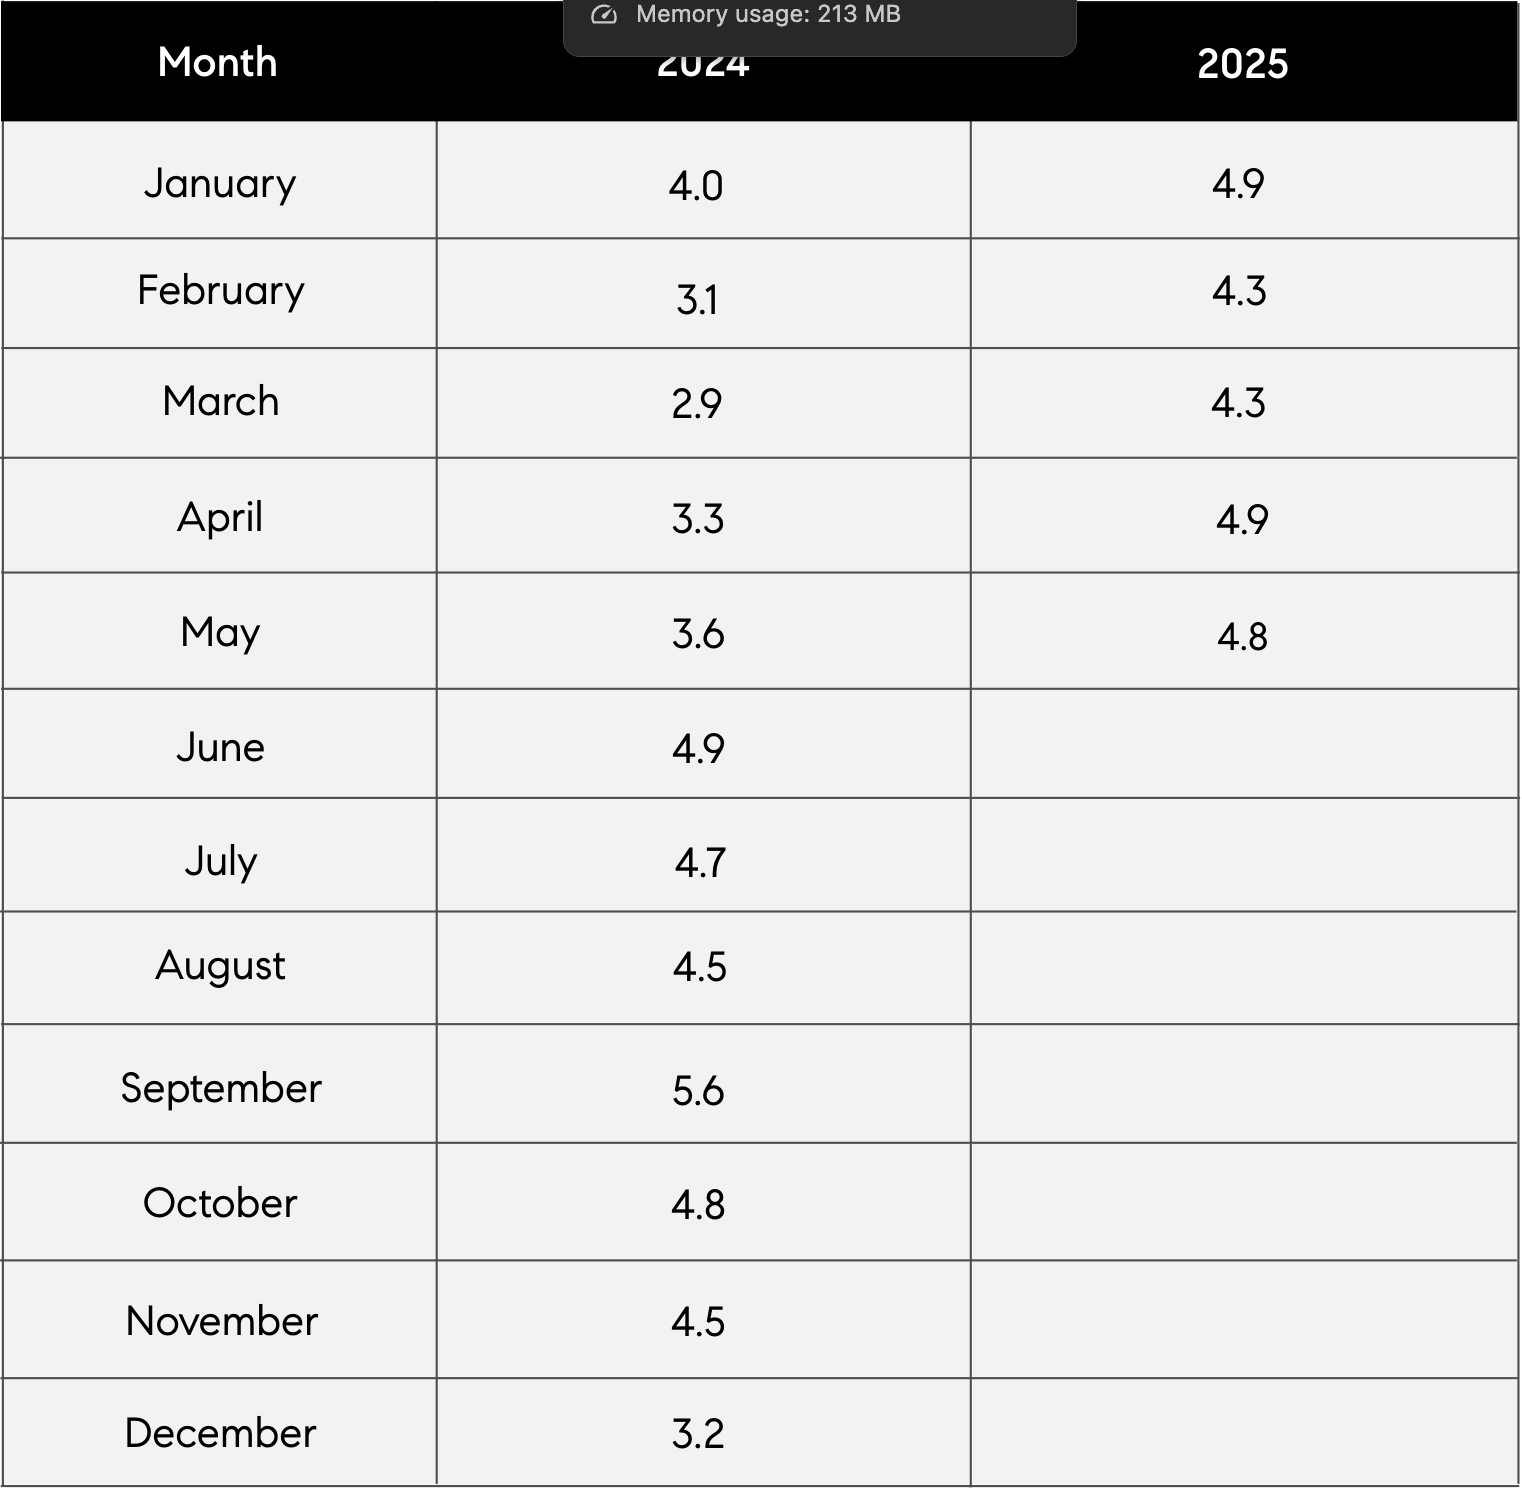
Real estate economists tell us a six-month supply of For Sale Inventory represents a balanced market between sellers and buyers.
Over six months of For Sale inventory indicates a Buyer’s market. Less than six months of inventory indicates a Seller’s market.
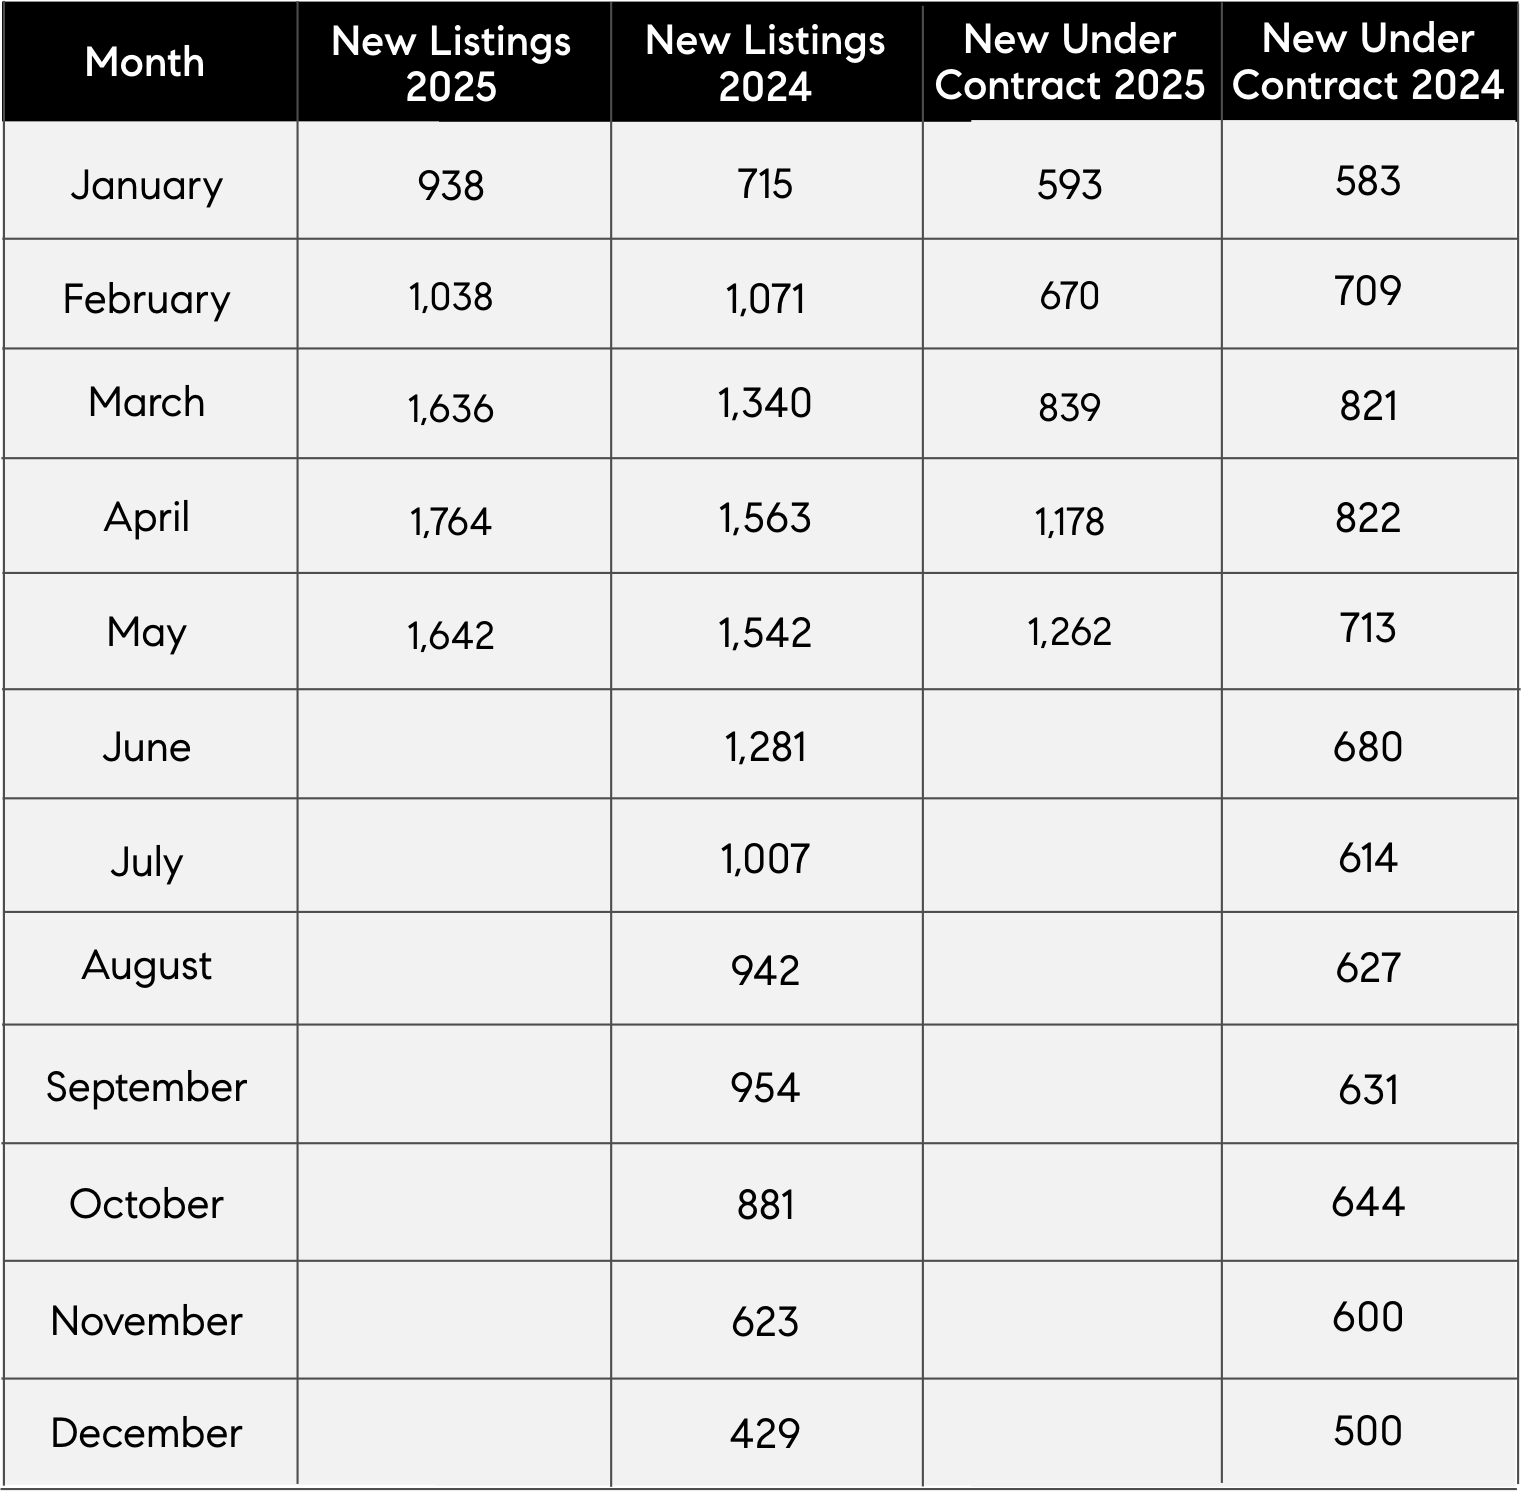
New Listing Taken | New Under Contracts
The Importance of Pricing in a High-Supply Market
As the number of homes available in the City of Austin continues to rise, setting the right price has never been more important.
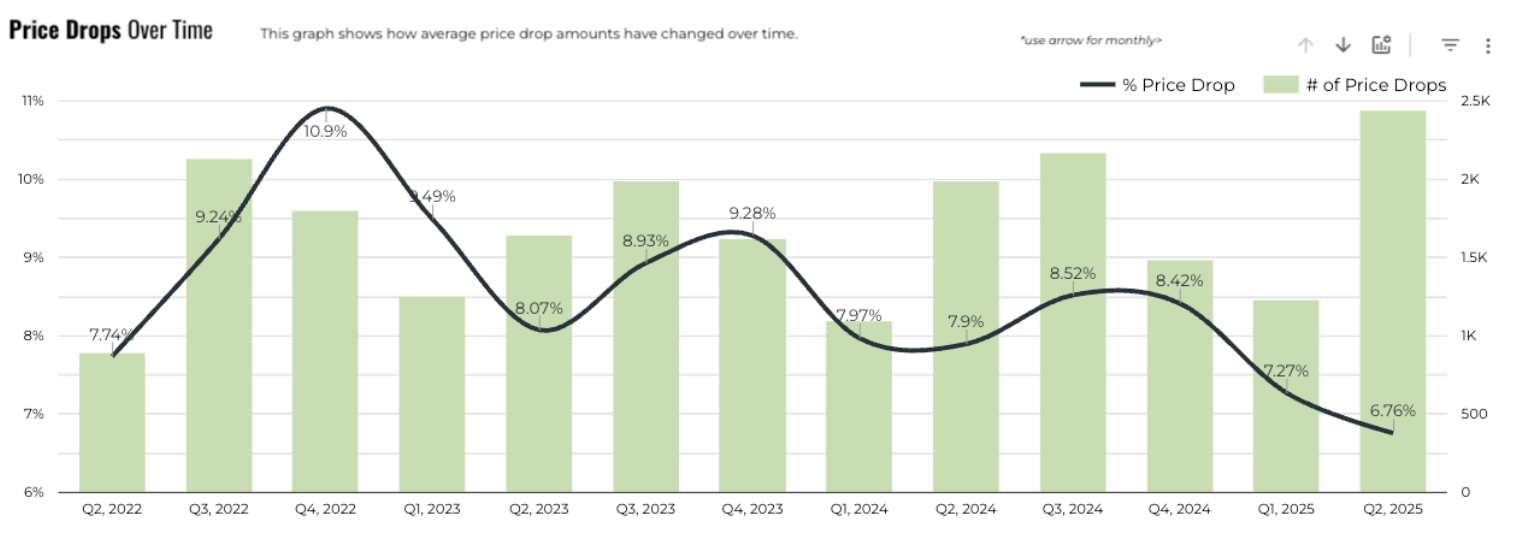
In the second quarter of this year, we observed more price reductions than in any quarter since 2022.
Smaller price decreases may suggest a shift toward more accurate initial pricing. In May, over half of the available inventory underwent a price cut, averaging a 7% reduction.
The Importance of Pricing in a High-Supply Market
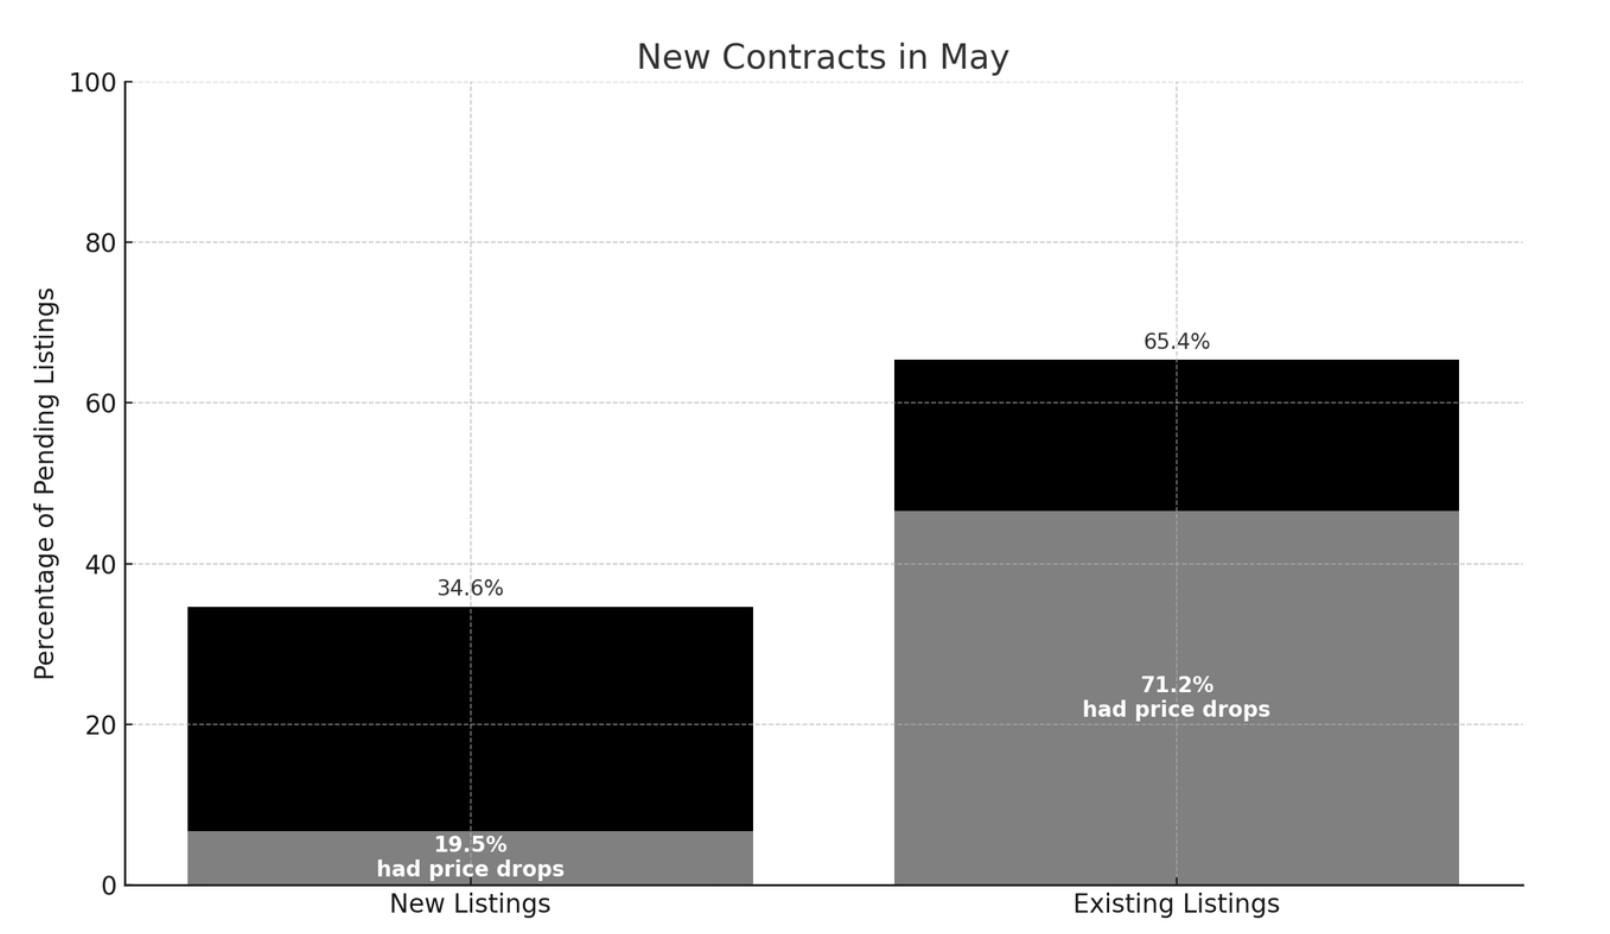
In May, the market clearly favored new inventory. Among the homes that went under contract, 35% were newly listed, with only 19.5% of those listings needing a price reduction.
Conversely, 65% of contracts involved existing listings, and over 71% of those listings had to lower their prices to attract buyers. This underscores the strong demand for new listings and the growing importance of strategic pricing.
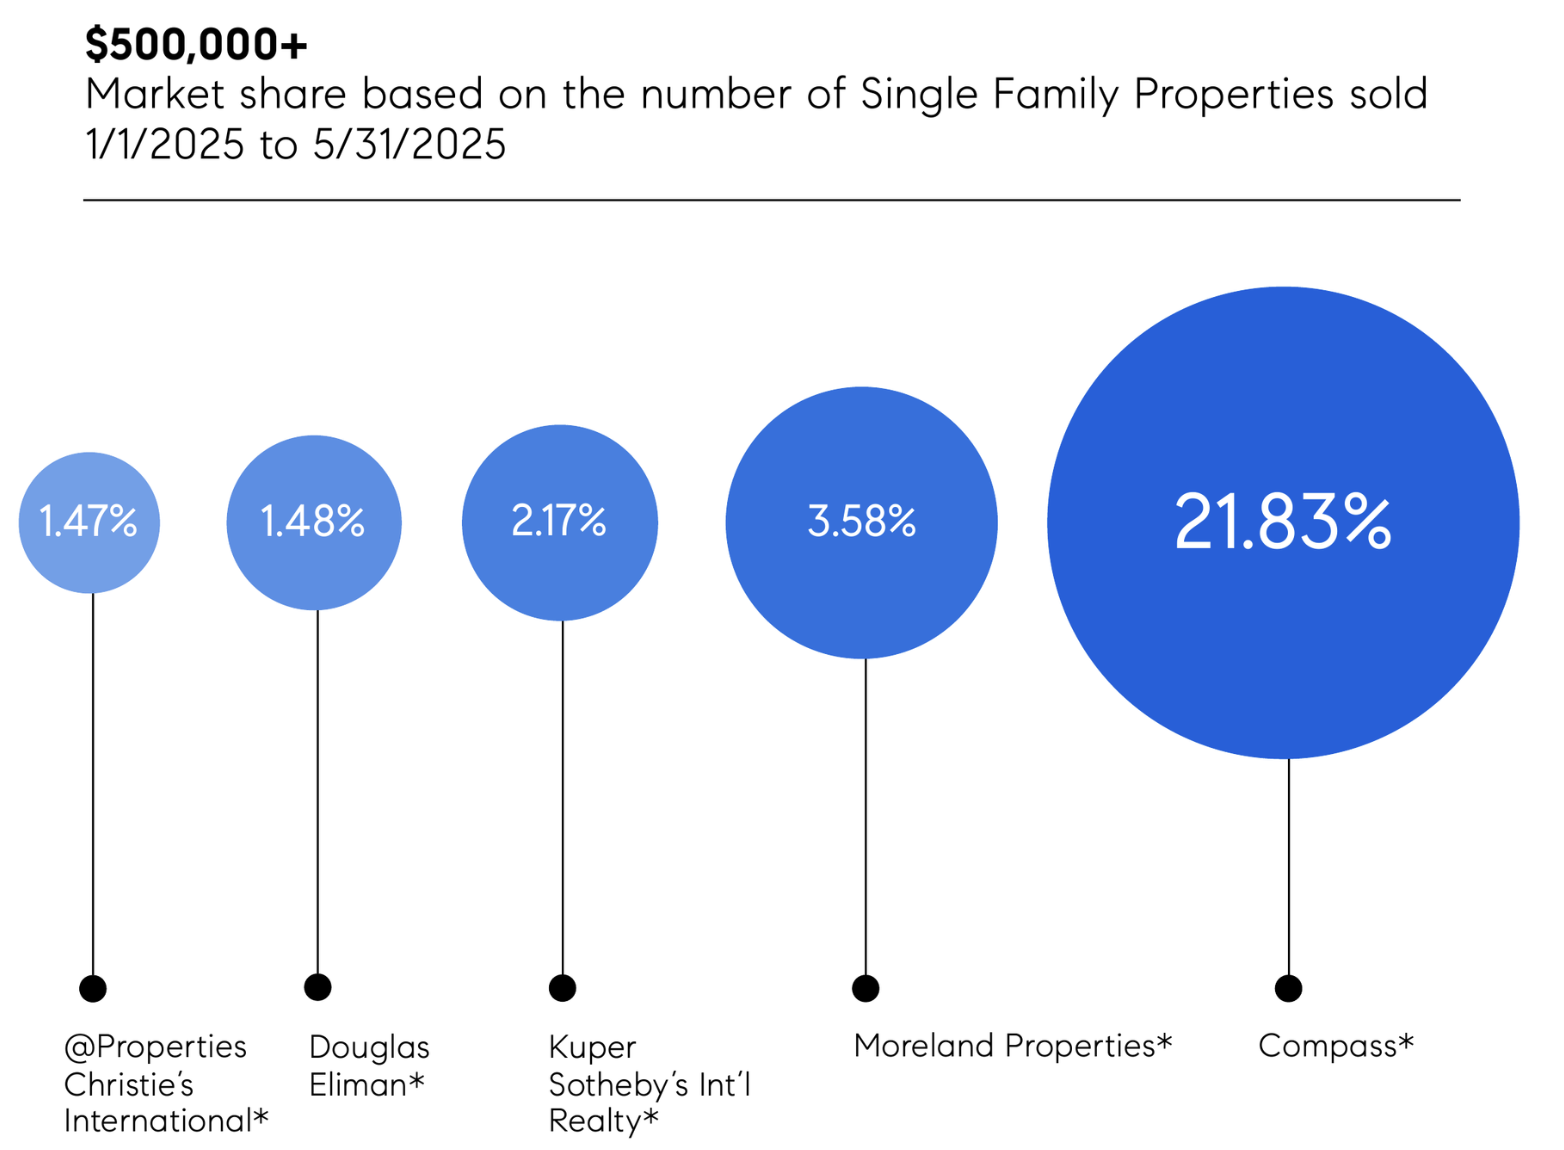
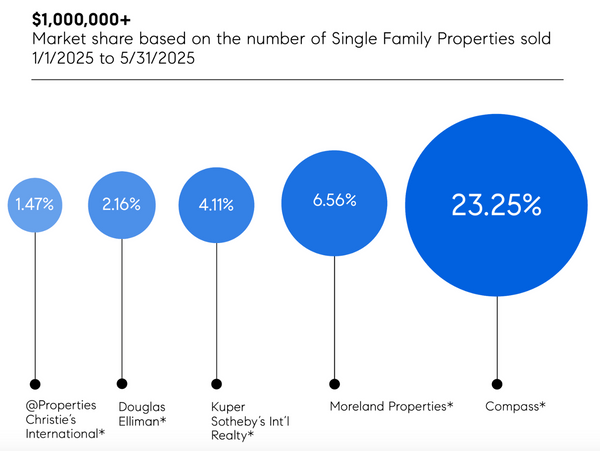
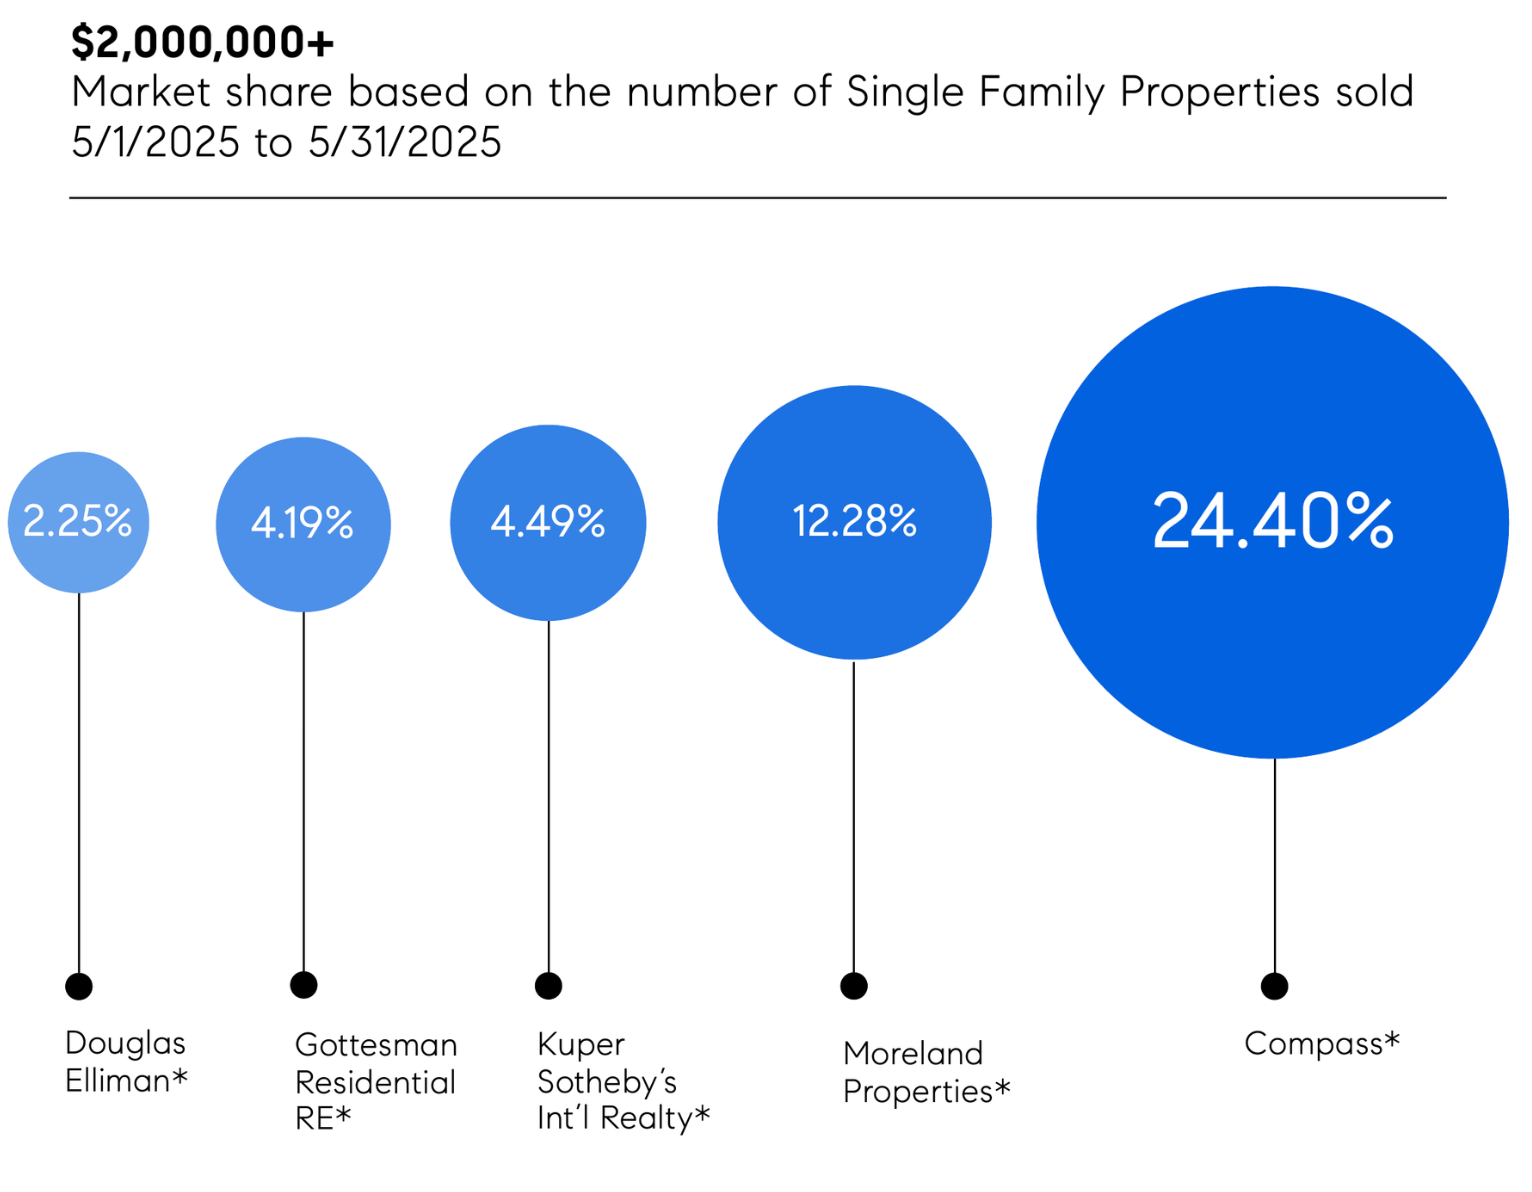
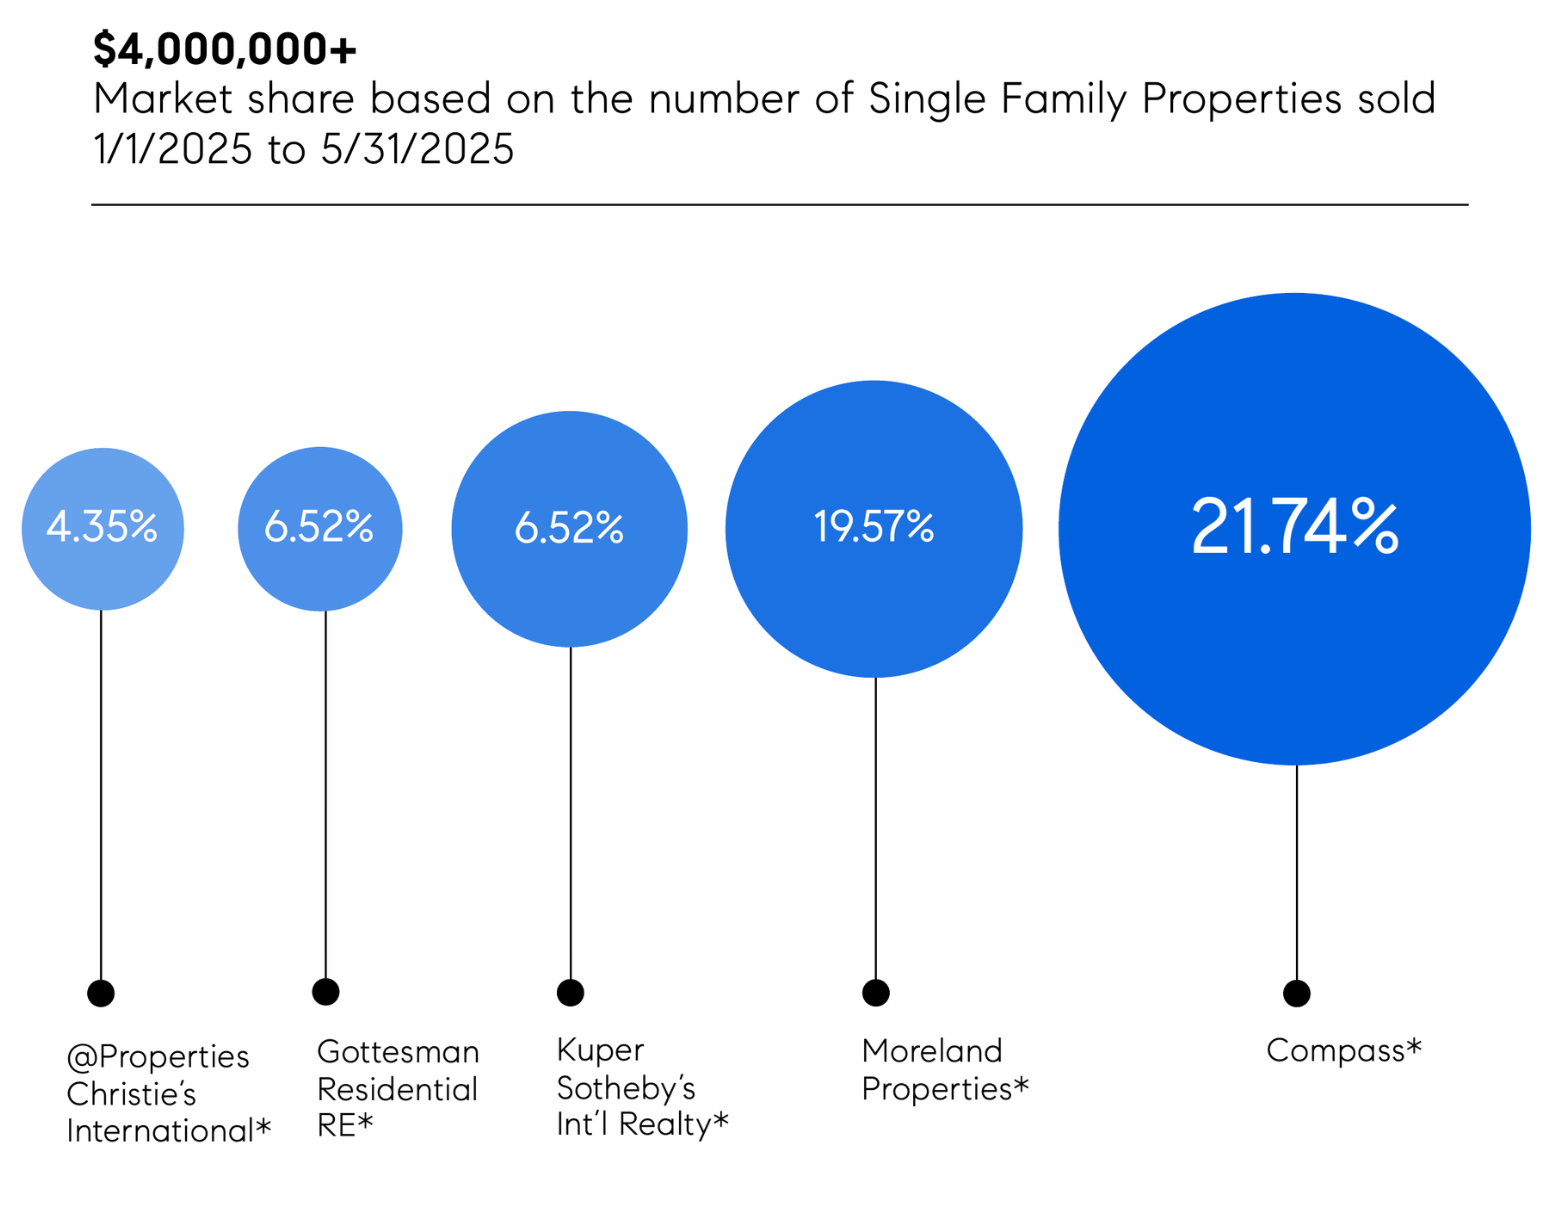
Compass Market Share By Price Sold Single Family Property

Thanks for reading!
Ready to achieve your next real estate goal?
Please reach out to get started! Beata@Beataburgeson.com