

Blog > Your September 2025 Market Report
Your September 2025 Market Report
Click below to view the September Market Report.

What Went Down in September
Market Overview
In September, Austin recorded 691 single-family home sales, marking a 20.4% increase compared to the previous year.
New contracts totaled 709, reflecting a 12.5% rise year-over-year.
The median sales price dropped by 4.8% to $590,000 from last year.
The average sales price declined by 2.3% year-over-year to $774,448.
The price per square foot fell month-over-month to $326.
Year-to-date, the average price per square foot is $343, a 2.3% decrease from the same period last year. In September, the average days on market for closed sales was 67 days, which is a 36% reduction compared to the previous year.
Months Supply Of Inventory
As of October 9, 2025, active listings stand at 3,181, with 966 new listings added—an increase from 951 in September 2024. The months of supply currently sits at 4.60, showing a downward trend due to fewer new listings and consistent positive pending sales.
Price Cuts & Compression
Price reductions are a significant market factor. Currently, 61% of active listings have seen a price drop, with the average reduction being 9% off the original asking price. On average, the first price drop occurs after 19 days, and it takes an additional 26 days from that price drop to go under contract. Homes that adjusted pricing moved faster after the drop, further emphasizing the need for correct initial positioning.
List-to-Close & Buyer Leverage
Homes closed at 91.43% of the list price in September , an average increase of -0.73% year-over-year. Combined with widespread price cuts, this signals continued buyer negotiating strength.
Buyers: Be prepared to act quickly on prime, well-presented homes, as they still generate significant interest.
Sellers: Avoid overpricing. Test pricing before going on the market. Staging, professional presentation, and strategic pricing are crucial to avoid low offers.
90-Day Trend
Active inventory has decreased from its May peak to 3,181 listings. The median Days on Market (DOM) for closed sales in September increased by 3 days from the previous year, reaching 51 days. Despite a slowdown in new inventory, pending sales continue to show positive year-over-year growth into the fall market.
What’s Coming Next (60-Day Outlook)
Sustained Buyer Leverage: Buyer-friendly conditions are expected to persist, driven by elevated active inventory and increased competition among sellers. As of October 9, active listings stand at 3,181, and 61% of all active listings have seen a price drop, averaging 9% off the original price. This pricing pressure will continue through the end of the year.
Decelerating Demand and Sales: Historically, new listings and sales tend to dip into the late fall and winter months.
- In the past year (2024), new listings fell from 878 in October to 622 in November and new under-contracts followed a similar trend.
- While September 2025 saw a stronger year-over-year performance in closed sales and new under contracts, the general downward slope of the late-year seasonality is expected to moderate activity levels.
Days on Market (DOM) Will Lengthen: As the holiday season approaches, buyers typically become more selective, leading to longer marketing times. The median DOM in September was 51 days. We anticipate this metric to continue climbing towards the high end of the recent range, reinforcing a slower-paced market environment.
Price Adjustments Remain Essential: With a high percentage of inventory requiring a price reduction, competitive, strategic pricing from day one will be the deciding factor for sellers aiming to avoid the seasonal slowdown.
View and Download the ATX Market Report
Average Days on Market Sold Price to Original List Price %
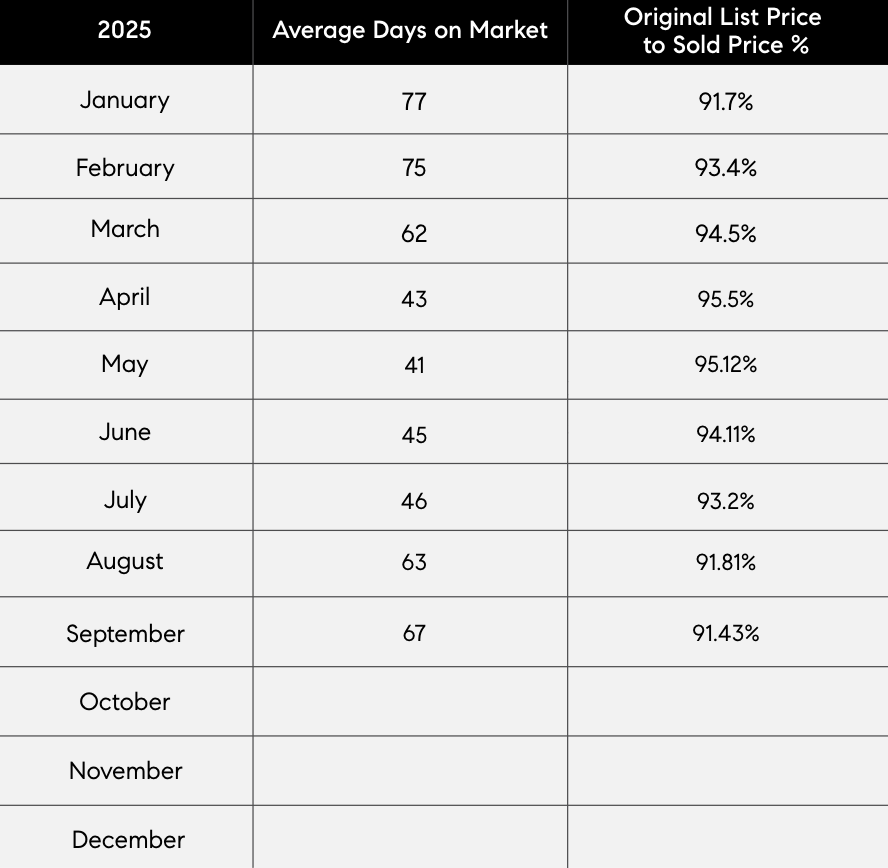
The Average DOM shows the number of days a property was on the market before it sold. An upward trend in DOM indicates a move toward a Buyer’s market.
The Sold Price vs. Original List Price reveals the percentage of the Original List Price properties sold for.
Monthly Supply of Inventory
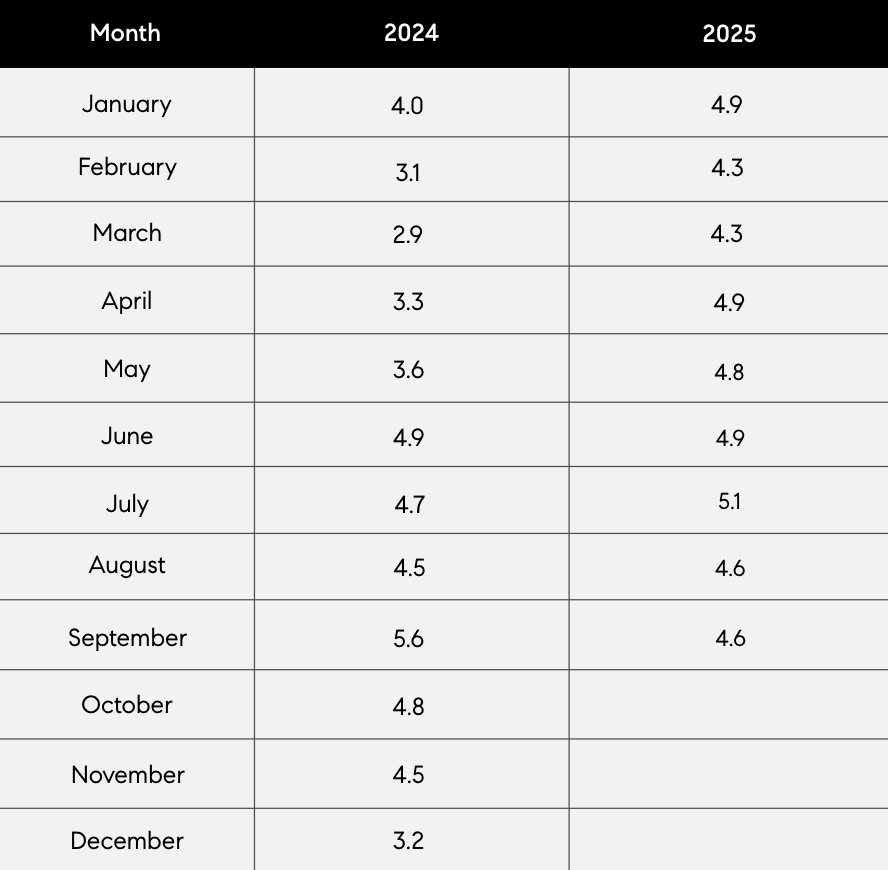
Real estate economists tell us a six-month supply of For Sale Inventory represents a balanced market between sellers and buyers.
Over six months of For Sale inventory indicates a Buyer’s market. Less than six months of inventory indicates a Seller’s market.
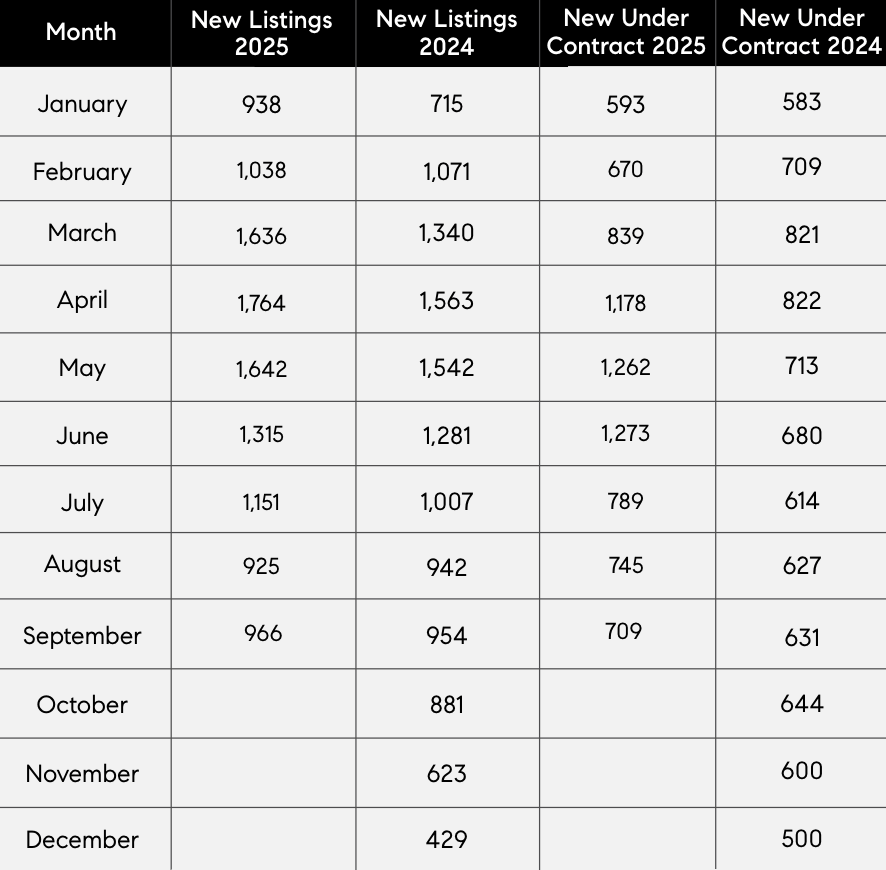
New Listing Taken | New Under Contracts
View and Download the ATX Market Report
Thanks for reading!
Ready to achieve your next real estate goal?
Please reach out to chat.